 |
|
Debugging |
| Course Outline |
📝Download
|
| Software Installation |
IDE:
|
| Reading Material |
|
|
Useful References
|
|
| Day | Module | Sharing |
|---|
| 1 |
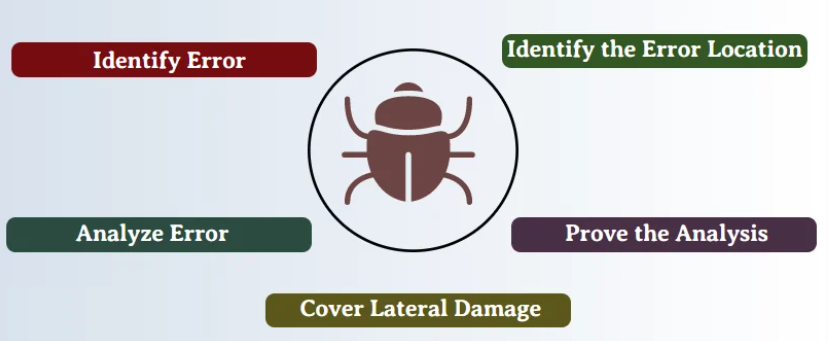
- Fault, Error, and Failure
- Different Types of Error
- What is debugging?
- Debug a Basic Project
- Inspect Variables
- Stepping Into and Over Function Calls
- Step Out
- Start debugging
- Step into code, line by line
- Step through code, skipping functions
- Run to a specific location or function
- Move the pointer to change the execution flow
- Step into non-user code
- Step into properties and operators in managed code
- Setting a function breakpoint in source code
- Setting Other Kinds of Breakpoints
- Setting a Breakpoint in the Call Stack Window
- Setting a Breakpoint in the Disassembly Window
- Managing Breakpoints
- Breakpoint conditions
- Using Object IDs in Breakpoint Conditions
- Hit Count
- Filter
- Breakpoint Actions and Tracepoints
- Breakpoint labels
- Export and Import Breakpoints
- Troubleshoot breakpoints
- Autos and Locals Windows
- Watch and QuickWatch Windows
- Disassembly Window
- Call Stack Window
- Registers Window
- Modules Window
- Memory Window
|
|
| 2 |
- Managing Exceptions with the Exception Settings Window
- Setting the debugger to continue on user-unhandled exceptions
- Continuing Execution After an Exception
- How to Examine System Code After an Exception?
- How to use Native Run-Time Checks?
- Attach to a running process on the local machine
- Attach to a process on a remote computer
- Common debugging scenarios
- Troubleshoot attach errors
- Debug Threads and Processes
- Debug Multiple Processes
- How to use the Threads Window?
- How to switch to Another Thread While Debugging?
- How to flag and Unflag Threads?
- How to set a Thread Name in Native Code?
- How to set a Thread Name in Managed Code?
- Tips for Debugging Threads in Native Code
- Using the Tasks Window
- Using the Parallel Stacks Window
- How to use the Parallel Watch Window?
- How to use the GPU Threads Window?
- Just My Code
- Specify Symbol (.pdb) and Source Files in the Visual Studio Debugger
- Debug 64-Bit Applications
- Debugger Security
|
Breakpoints:
Exceptions:
Debug Running Processes:
Multithreaing:
Others:
|
| Recommanded Books |
|---|
 | Title | Inside Windows Debugging: Developer Reference |
|---|
| ISBN | 978-0-735-67348-9 |
|---|
| Author | Tarik Soulami |
|---|
| Year | 2012 |
|---|
| Publisher | Microsoft Press |
|---|
 | Title | Software Testing using Visual Studio 2010 |
|---|
| ISBN | 978-1-849-68140-7 |
|---|
| Author | N. Satheesh Kumar, S. Subashni |
|---|
| Year | 2010 |
|---|
| Publisher | Packt Publishing |
|---|
 | Title | Debugging Strategies For .NET Developers |
|---|
| ISBN | 978-1-590-59059-1 |
|---|
| Author | Darin Dillon |
|---|
| Year | 2003 |
|---|
| Publisher | Apress |
|---|